Cancer is a leading cause of morbidity and mortality worldwide, with significant personal, societal, and economic consequences.
A special attention in understanding and preventing the disease is given to risk factors that contributes to the development and to the spread of cancer. The literature devotes a large part to the investigation of these risks, and to how the proliferation of these risks’ factors reflects in the health state of the population, in the cost associated with the disease, in treatments developed to cure the illness.
Part of the research developed on risks factors for the 4PCAN project, the research team of the Bucharest of Economic Studies developed a “Cancer Risk Factors Index” (CRFI) that helps in understanding the relative importance of different cancer risk factors at the national level and in guiding targeted interventions for cancer prevention in EU countries. The index considers several categories of factors, that are the most encountered into the literature: obesity, alcohol and tobacco use, physical activity, pollution, socio-economic conditions, and diet. The Index used Eurostat data for the most recent period (2019, 2020, 2021 or 2022). To normalize the sub-factors effectively, the Min-Max normalization method was used, with a scaling of each value between 0 and 100. The Min-Max normalization method allows different sub-factors to be directly comparable on the same scale, ensures all sub-factors contribute evenly to the index and makes it easier to interpret normalized scores ranging from 0 to 100. The following formula was used for each country:

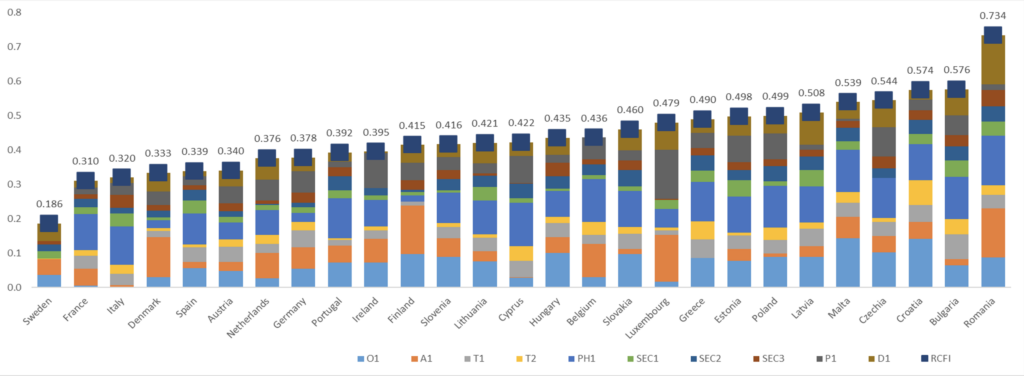
This formula scales the values to a range of 0 to 100, where 0 corresponds to the minimum observed value and 100 to the maximum. A normalized score closer to 100 indicates a higher impact of that sub-factor on cancer risk (depending on whether the sub-factor is positively or negatively correlated with risk). If a sub-factor is inversely related to cancer risk (e.g., education level), the scale was reversed, by subtracting the normalized value from 100 to interpret the risk correctly. For the aggregated score, the normalized sub-factor scores were multiplied by their weights and summed the results. However, in this case every category received the same weight, so it was equivalent to an arithmetic average of values for each category. After determining the aggregate scores for each country, countries were ranked based on RCFI, where a higher score indicates a greater overall impact of cancer risk factors, as in the figure below:

The codes for every subfactor are Share of overweight persons (O1), Excessive drink habits (A1), Tobacco smoking prevalence (T1), Exposure to smoking (T2), Sedentary behavior (PH1), Poverty rate (SEC1), Preventive expenditures (SEC2), Education level (SEC3), Emissions per capita (P1), Fruits and vegetables consumption (D1).

